
That title and this post are inspired by two of my favorite people in the whole world. We were having a conversation about life and everything else, and I was trying to explain my job and what I enjoy doing. In the last year at BlueLabs Analytics (check them out, they’re hiring!) I was lucky. After starting out on a data analyst contract, a promotion to a senior analyst with a full time role followed. A few months after, I became a data operations lead and also people manager. It was quite the year and a lot of people sponsored this journey. I thank them dearly ![]()
But I digress. We were going somewhere with that - the roles, I was in a lot of data roles and completed different functions. When Natalie wondered about what data people do, it seemed like the perfect post to explain that using a very tangible result so let’s get into it!!
Disclaimer: this is not all the data roles. I’m only going to address the big three and touch on others. Also note: organization size and data maturity will cause different delineations between roles, so if you go and ask your resident expert (as Angie calls them) and they tell you otherwise, that’s fine. This is an overview!!
The Product
You ever read those articles where it says “A Department of Health report shows that 56% of people are blah blah blah…” and then proceeds to show you and tell you what it’s telling you? Have you ever thought about how it came together? Let’s try that!
We’ll use one of my mini-projects as a product and I’ll tell you about all the data roles that got us there. Last year, I made a dashboard about Forbes highest earning athletes between 1990 and 2019 using some Kaggle data. That takes us to the first role which is (depending on where you work) the first or second part of the data process.
The Data Engineer
You will notice that one of the first things you can do on my simple dashboard is just display the data used to make the visualizations. Someone had to get the data, put it in a digestible format, name all the fields and make sure it was ingested and stored correctly into its home. Say this home is a database - we know basketball is played every year so this person would have set up a system where these events in a game are recorded and ingested with little manual work every time there is a game. They’d have to maintain their system (a.k.a a data pipeline) if the data changes. For instance, a team could move to a different city and the data engineer has to change the city name or code to look for on the data source before storing. Based on the job title, this person has a lot of data context to know how to properly store the information, and engineering skills to create and maintain the system that does the retrieval and storage. If we make the assumption that Kaggle is our database, the person who collected and shared this data for me to use on the dashboard is the data engineer in our lil example. As mentioned earlier, these roles may be bundled up depending on the size of a team. So if you are doing these kinds of tasks, but your title is data analyst, don’t forget to update that brag sheet and resume ![]()
a.k.a data developer, data integration engineer, business intelligence developer, data architect (with task variations of course), with elements of database administrator/manager
The Data Analyst
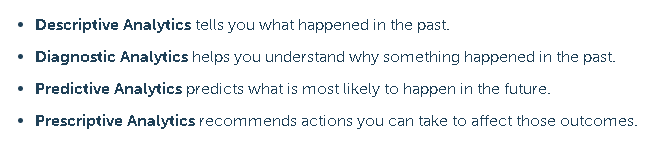
This is probably the most robustly undefined role in data there is out there. Given that, this definition is going to be an ideal of what could be at a data mature organization where all responsibilities and roles are well defined and funded. As a matter of fact, let’s apply this to all three. The not overworked data analyst should be able to take data from its storage location, and extract insights from it. Let me talk about statistics for a little bit here because it helps (me) with the delineation. If you take an introductory analytics course, you will hear about four versions of it: descriptive, diagnostic, predictive, and prescriptive analytics. In an effort to stay on track, here is what they mean in summary - courtesy of Logi Analytics.
Why am I telling you this? Well an analyst would live on the spectrum between descriptive and diagnostic kinda like the dashboard! What this looks like: with access to the data prepared by the data engineer, an analyst would be able to run some descriptive analysis with calculations like mean, mode, median, sums, and other aggregations. They would also be able to create data stories with visualizations and quick insights using tools like Tableau and PowerBI. Depending on how distributed the work is, they may venture into investigating the tip (or more) of the iceberg for the diagnostics (why are things happening based on past events data?). Notice, there are no models or predictions because the storytelling in this role is based on what has happened and what it means/could mean. Some questions you may be trying to answer while in this role include:
- What happened here (who earned the most sports money between 1990 and 2019)?
- Why did it happen a.k.a WHHW vibes (discussion about what may have caused this based on general information and research of the sports industry)?
- Are there segments of the data we can look at separately? Does what happened appear differently depending on the different groupings? (how do earnings change depending on the sport you play? or your age?)
- what useful periodic metrics can we track for this process/product in a report format?
*In real life, data analysts in companies may have to do way more than descriptive and diagnostic storytelling with statistics and visualizations. When my job title was analyst, I was also troubleshooting some data pipelines. Some companies want their analysts to also work in the predictive and prescriptive analytics space. Be mindful of this when you are looking for jobs because it does not necessarily mean that you are lacking in skills. The organizational maturities are different out there, and that determines how many job roles they will ask one person to do.
a.k.a business intelligence analyst, data quality analyst, (insert tool here e.g. Tableau) analyst, quantitative (data/risk) analyst, reporting analyst
The Data Scientist
a.k.a the sexiest job title in data ![]() . Personally, data engineering is more interesting but to each their own right? So remember the four analytics segments above? The data scientist resides in all four of them with the expectation that they live in the predictive and prescriptive neighborhoods. This also bring up one of my death hills -> best progression to being a data scientist is to start as an analyst because you get time to do and understand all the analytics phases. Now don’t let this stop you from being great. It’s just an opinion. A data scientist may be expected to take that Forbes dashboard and answer the following questions:
. Personally, data engineering is more interesting but to each their own right? So remember the four analytics segments above? The data scientist resides in all four of them with the expectation that they live in the predictive and prescriptive neighborhoods. This also bring up one of my death hills -> best progression to being a data scientist is to start as an analyst because you get time to do and understand all the analytics phases. Now don’t let this stop you from being great. It’s just an opinion. A data scientist may be expected to take that Forbes dashboard and answer the following questions:
- what can we conclude causes this occurence (what factors e.g. age, weight, college attended - determine whether or not an athlete will be on the Forbes list? What is an appropriate model to test this theory?)
- using what we find in terms of cause/effect, what actions would we recommend to someone interested in a specific outcome a.k.a a stakeholder (what endorsements would I tell a sports agent to target so their client can climb the Forbes highest paid athletes list?)
- can I simulate some of the situations observed in the data to test out a theory (what experiment can I set up with control and treatment groups to test a hypothesis for factors that influence athlete pay?)
*I realize there were a lot of mathy/statistics words used above. If you would like to dig deeper with statistics, here is an introductory course I go back to often because “use it or lose it” is always in effect when it comes to data skills.
a.k.a (insert industry name here e.g. health) data scientist, quantitative analyst, research data scientist
The Others (or some of them at least)
These are very loose descriptions of some of the other prominent roles in data. I don’t know everything so please feel free to keep learning and exploring all the (data) things you can be!
- Analytics engineers are a liaison between data engineers and data analysts who takes the data from it’s stored form and transforms it for reporting, analysis, dashboards etc. It has popped up in recent years on teams that are more data mature with every member in their focus area.
- Machine Learning/AI researchers work at the intersection of cutting edge data methods/tools/ethics research and data science. Think a PhD-like data job where you are researching and experimenting more than practicing.
- Machine learning engineers are if a data scientist and data engineer had a baby that was mostly tasked with making sure the data scientist’s job is automated and productionized i.e. if it’s repeatable, can we make a system or framework for (and of course maintain) it?
- Data managers lead teams comprising of a lot if not all of the roles mentioned above while balancing team needs and company goals.
- Data product managers facilitate the ideation, creation, and testing of data products, with a lot of liaising between the data team and the product client.
Hopefully, this was a good primer to help you understand what all the noise is about in the data section of tech. Data is everywhere. In the age of technology, you can track everything (or rather everything is being tracked). That presents a lot of opportunities to enter the data field and become more data literate as a general citizen of the world. Enjoy your data exploration journey!!
Till next time, good night. To quote Miz Cracker, time for dinnerrrrrrrrrrr ![]()